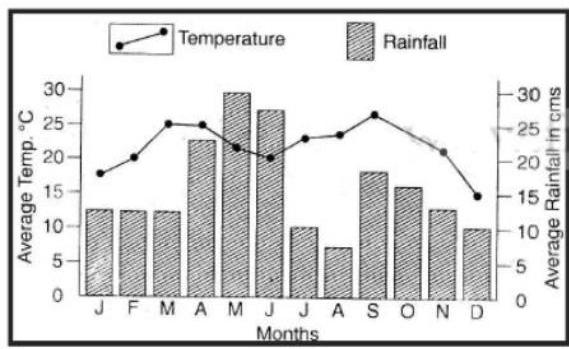
The graph given below shows the mean average monthly temperatures (in °C) and mean monthly rainfall (in cms) of a place: This graph is indicative of which one of the climatic zones of the world?
A
Wet and dry tropical
B
Rainy tropical
C
Semi-arid tropical
D
Temperate marine
Correct Answer: Option A
Explanation
1. The graph shows mean monthly temperatures (line graph) and mean monthly rainfall (bar graph) for a place.
2. Temperature Analysis: The temperature is consistently high throughout the year, hovering around 25-30°C, with minimal variation between months. This indicates a tropical location.
3. Rainfall Analysis: There is significant rainfall in almost all months, with peaks suggesting very high rainfall periods. There isn't a distinct long dry season.
4. Climatic Zone Identification:
- (A) Wet and dry tropical (Savanna) climate has high temperatures but a distinct dry season.
- (B) Rainy tropical (Tropical Rainforest) climate is characterized by consistently high temperatures and high rainfall throughout the year, without a significant dry season. This matches the graph.
- (C) Semi-arid tropical (Tropical Steppe) climate has high temperatures but low rainfall overall.
- (D) Temperate marine climate has moderate temperatures with distinct seasons and moderate rainfall, which does not match the graph.
5. The graph, showing high temperatures and high rainfall year-round, is indicative of a Rainy tropical climatic zone.
More Geography (Physical) PYQs
- Consider the following statements : 1. Statement I: The amount of dust particles in the atmosphere is more in subtropical and temperate areas than in equatorial and polar regions. 2. Statement II: Subtropical and temperate areas have less dry winds. Which one of the following is correct in respect of the above statements?
- Consider the following statements : 1. Statement I: In January, in the Northern Hemisphere, the isotherms bend equatorward while crossing the landmasses, and poleward while crossing the oceans. 2. Statement II : In January, the air over the oceans is warmer than that over the landmasses in the Northern Hemisphere. Which one of the following is correct in respect of the above statements?
- Consider the following statements : 1. Without the atmosphere, temperature would be well below freezing point everywhere on the Earth's surface. 2. Heat absorbed and trapped by the atmosphere maintains our planet's average temperature. 3. Atmosphere's gases, like carbon dioxide, are particularly good at absorbing and trapping radiation. Which of the statements given above are correct?
- Consider the following statements : 1. Statement I: Scientific studies suggest that a shift is taking place in the Earth's rotation and axis. 2. Statement II : Solar flares and associated coronal mass ejections bombarded the Earth's outermost atmosphere with tremendous amount of energy. 3. Statement III : As the Earth's polar ice melts, the water tends to move towards the equator. Which one of the following is correct in respect of the above statements?
- Consider the following statements : 1. Statement I: In the context of effect of water on rocks, chalk is known as a very permeable rock whereas clay is known as quite an impermeable or least permeable rock. 2. Statement II : Chalk is porous and hence can absorb water. 3. Statement III : Clay is not at all porous. Which one of the following is correct in respect of the above statements?
- Consider the following statements : 1. Anadyr in Siberia and Nome in Alaska are a few kilometers from each other, but when people are waking up and getting set for breakfast in these cities, it would be different days. 2. When it is Monday in Anadyr, it is Tuesday in Nome. Which of the statements given above is/are correct?
Master UPSC Revision
Get 10,000+ topic-wise MCQs, spaced repetition, daily CSAT challenges, and detailed performance analytics.
Coming Soon to Play Store